
Mission #03
Context
After our last call, Pedro met with the Marketing team and the Sales team to discuss what would be the best option for both teams to work with the same data and get rid of the problems that might appear if both teams work in different ways.
One of the analysts commented that he has experience with SQL and he took the responsibility of trying to obtain the data directly from the database. Therefore, it would no longer be necessary to make manual interventions to export data from the system.
Pedro headed to the IT team to try to get a user to access the database. But the IT analysts were unable to attend the request due to security issues and also because they needed to understand better about the project, since IT was not involved so far.
The IT analysts asked Pedro to speak with João Paulo, Financial Administrative Manager and responsible for the IT team, to better align these points and verify this possibility. It is worth remembering that, in Brazil, HPN does not keep an IT Management, but only a maintenance and support team that is part of the Administrative-Financial Management.
Pedro preferred to wait a little longer and bring to João Paulo something that would be more decisive, presenting a scenario that would bring a direct benefit to both managements.
Today, IT has a support analyst who spends almost 100% of his time creating analysis directly in the database for other areas. And this is another bottleneck of the company: this dependency and excessive delay in performing analysis.
Not to mention that financial analysts suffer from the same problems as Pedro’s analysts: delays in creating reports, high amount of manual work, etc.
So, one of the many ways Pedro realized to benefit João Paulo would be to optimize the work of this analyst by creating the same analysis inside Power BI. And, of course, also helping João Paulo to have faster access to financial information.
Goals
The time has come to show that we are the best when it comes to calculation and data analysis. In this mission we will use all our knowledge in the DAX language to make some super interesting analyses that Pedro asked us and that will help both him and João Paulo.
Along with that, we will also show João Paulo how much his time and his team’s work will be optimized when the project is running automatically.
You already have the necessary data for all the analyzes that you will create in this mission. Now it is time to get your hands dirty:
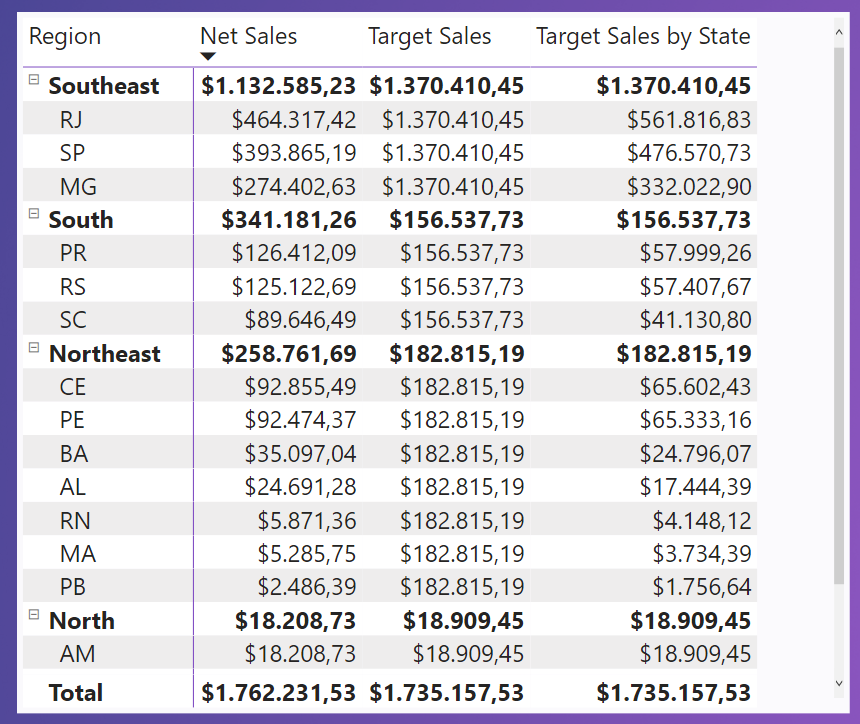
1. At this moment, HPN only has a target for regions (supervisors). However, Pedro would like to have a comparison indicator between the Net Sales and Target by States as well. Therefore, allocate the monthly target to the customer’s state using the DAX language, applying a ratio rule that you consider appropriate.
2. Pedro is concerned about some flavors and sizes of products that are in stock and unsold, especially the items in the subcategory Whey Protein, which are very important for HPN. So, make an analysis of how many different items of this subcategory remained unsold over the months, as in the example below:
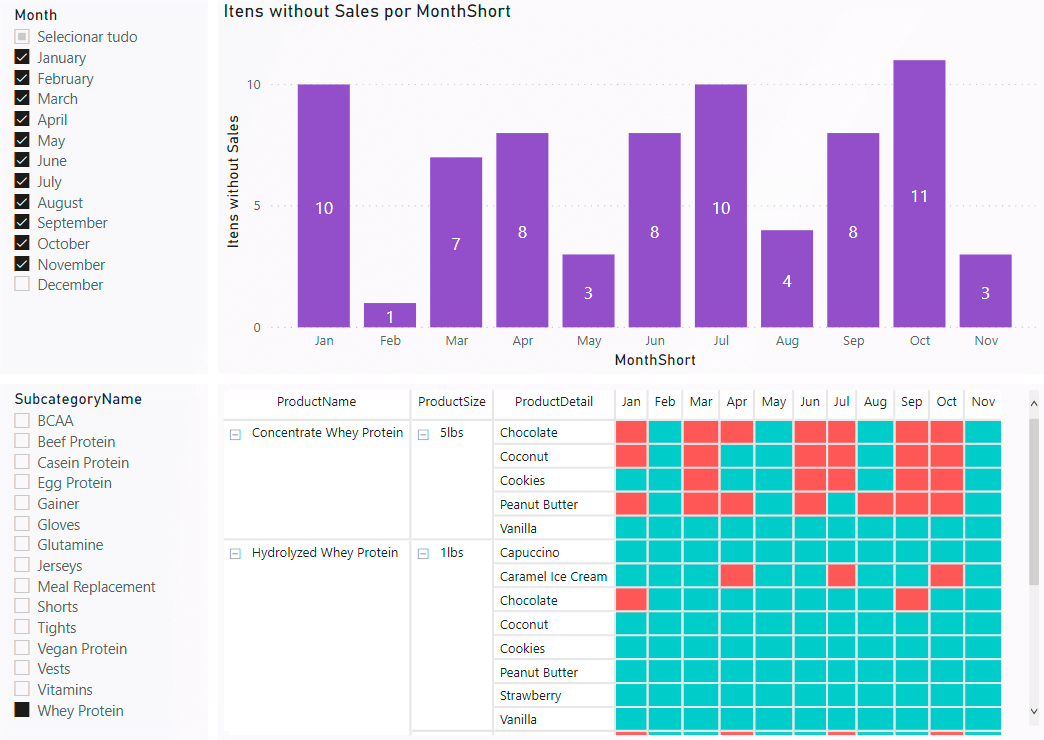
In the Matrix visual above, the red square indicates that the item was not sold in that month, while the green indicates that it was sold in the period. Knowing that Hydrolyzed Whey and Isolate Whey are very similar products, what could you suggest to Pedro to avoid that the Isolate Whey Protein items stay in stock for a long time without sales?
3. Pedro monitors an indicator of how many sales were made for each product in the last 90 days (relative to a date filter). His goal is to make at least 5 sales per product in the last 90 days to consider this product as active in the selected period. Thereby, create a dynamic segmentation to identify how many products fit into the following categories:
- High Frequency: 10 or more sales in the last 90 days.
- Medium Frequency: between 5 and 9 sales in the last 90 days.
- Low Frequency: between 1 and 4 sales in the last 90 days.
Remember that this analysis must be dynamic and take into consideration the date filter on the report, as below:
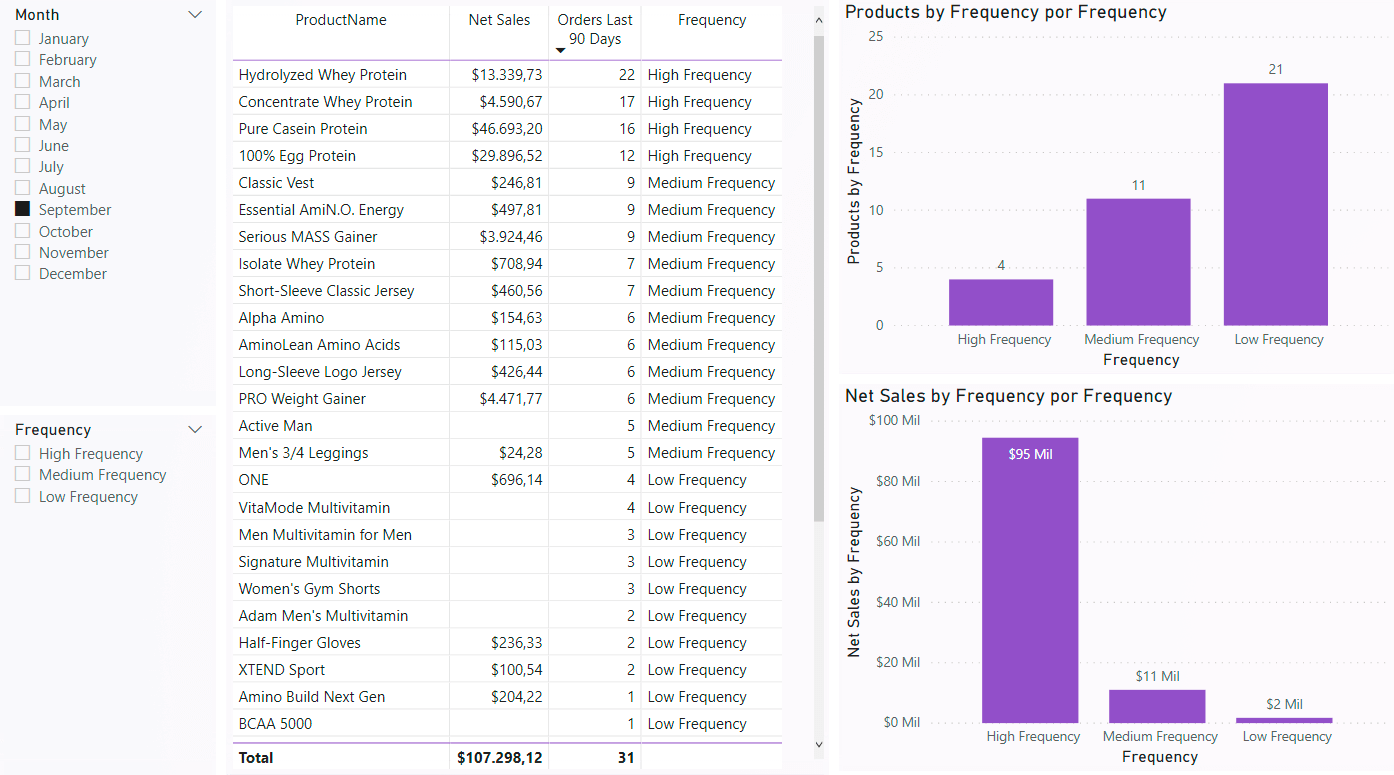
In the image above we can see that in September there are 4 products with high frequency sales, 11 products with medium frequency and 21 products with low frequency.
It is important to notice that there are several products with the same name, varying in flavor and size. In this analysis, Pedro is not concerned about the different sizes and flavors. Therefore, always use the “ProductName” column as a reference in the calculations, so that all possible variations are grouped into a single product name.
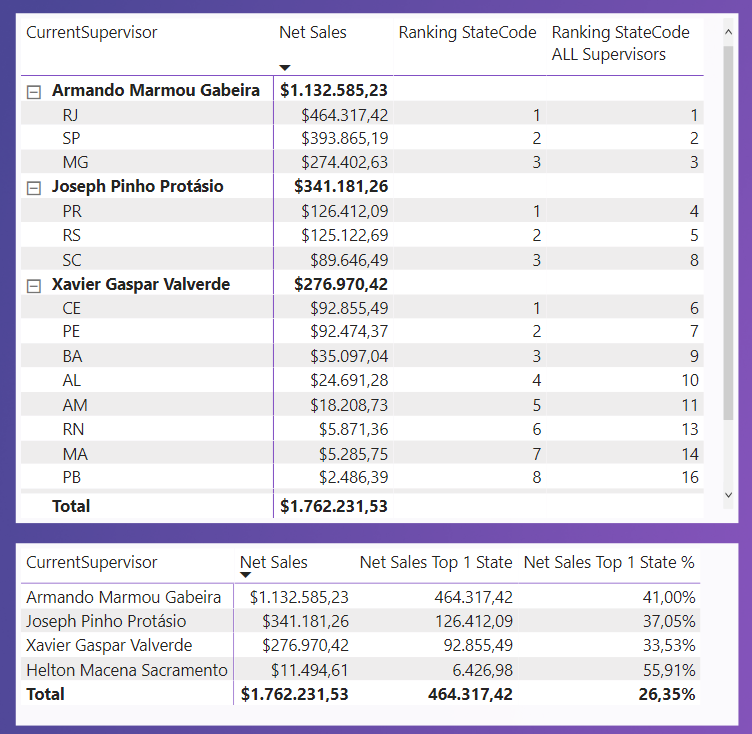
4. Pedro needs to compare the performance over the States. So, create the following measures:
- Ranking StateCode, comparing its Net Sales with states from the same supervisor;
- Ranking StateCode ALL Supervisors, comparing its Net Sales with states from all supervisors;
- Net Sales for the best state in each supervisor (Net Sales Top 1 State) and its percentage compared to the supervisor’s total (Net Sales Top 1 State %).
5. Pedro wants to see on a page the total amount of Net Sales that HPN should receive in the next 30 days, based on a dynamic selection in a date filter. For example, when selecting a specific day in a filter you must list which invoices will be received within 30 days and their total amount. Check out the example below:
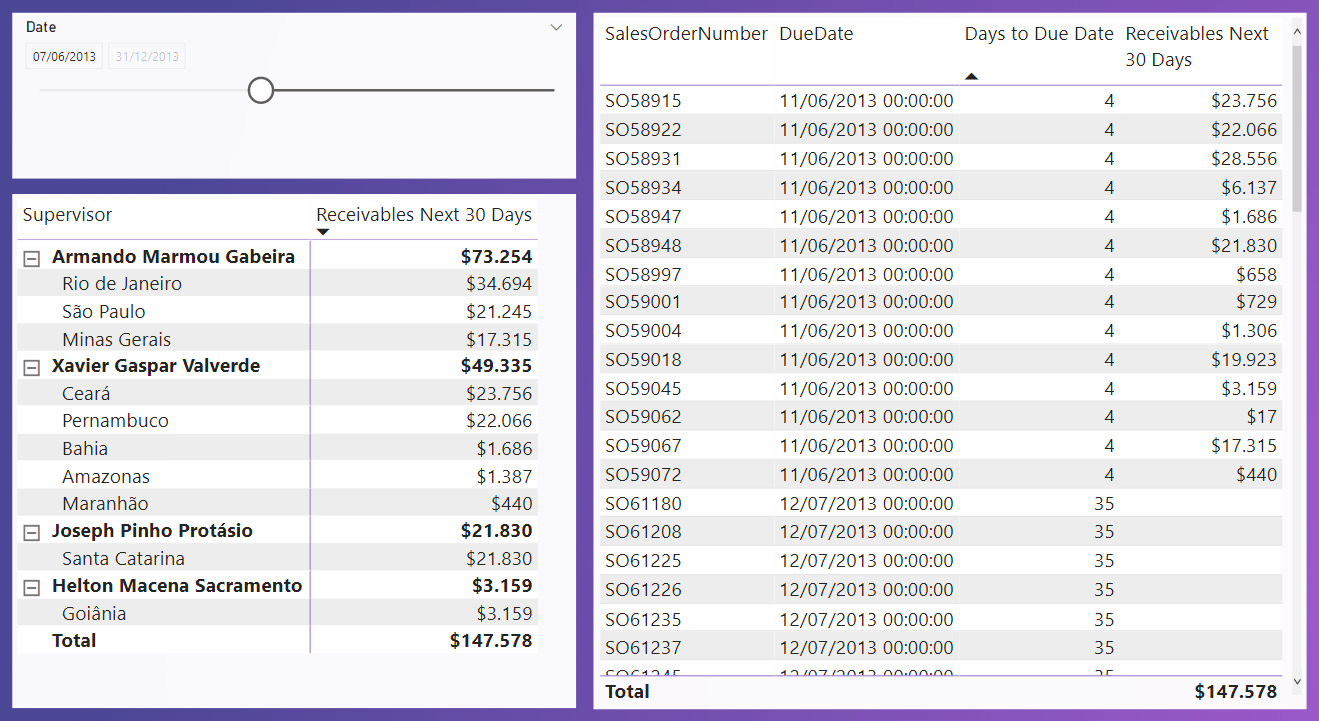
In the example above, the company has $147,578 to receive between 07/Jun/2013 and 07/Jul/2013. This analysis will directly help João Paulo’s financial team. So do a great job here!
6. Something very important in HPN's business model is cross-selling. This is the case of BCAA sales combined with Whey Protein. These are products that always need to be sold together. So do an analysis of how many sales contained Whey Protein, but did not have any BCAA products, as in the example below:
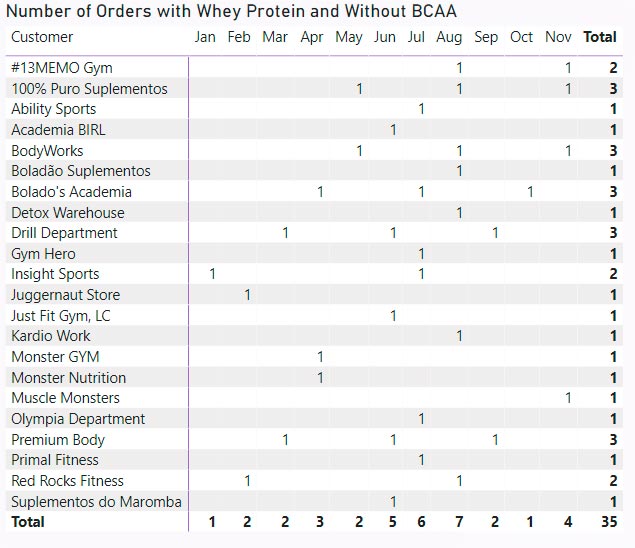
In all of these 35 sales it was left "money on the table" and the responsible Salesperson failed at the moment of the sale.
The Mission will only be considered concluded if you complete all 6 items on the list above.